
2022-23 Offensive Autopsy, Part II
Investigating the legitimacy of Seattle's offensive improvement, by the numbers


Allyson is a freelance writer covering all things Seattle Kraken. Find more from her on Twitter (@strainsovhorror) & Instagram (@allysonnballard)
Inquiries? Reach out to allysonnballard@gmail.com
*All data five-on-five and dealing in the regular season. In the interest of clarity, “scoring opportunities” and “offensive situations” will be used interchangeably to describe the general effort by a team to score (no singular statistical equivalent).
Stats via MoneyPuck, HockeyViz, NaturalStatTrick, AllThreeZones, NHL.
Offense is a process that can be broken down into two stages: generation (creating scoring opportunities) and finishing (capitalizing or not capitalizing on them), with the moment a shot is delivered distinguishing the two. Generation encompasses every decision made by the attacking team creating the opportunity to shoot, as well as the nature of the shot itself; it’s wholly strategic. Finishing is whatever the outcome of that shot is.
Understanding that a shot is taken with the intent of scoring, and that a team cannot control if a shot actually scores once it leaves the skater’s stick only intensifies the importance of strong generative habits. Ideally, teams work to create offensive situations resulting in a shot with the highest likelihood of scoring, ensuring they are leaving as little to chance as possible.
Because that’s what finishing is– a process left to chance. Scoring is never guaranteed. An attacking team can do everything ‘correct’ in setting up scoring opportunities and still fall short, often for reasons totally irrelevant to their skill.
Viewing the process of offense in this way allows us to appreciate that there are both controllable and uncontrollable factors at play in determining how offensive situations pan out. And while there are nuances– like that the attacking team cannot control the defensive response of their opponent and must mold their decision-making accordingly– for the most part, generation is controlled by the attacking team and finishing is out of their hands.
Generation is most representative of a team’s offensive skill. Evaluation which does not take into consideration the distorting quality of finishing risks inaccuracy, of which the Seattle Kraken were vulnerable to this past season.
Seattle became the most productive five-on-five team in the league after suffering through an inaugural season as one of the worst. Last we met, however, a discrepancy was discovered between their generative and finishing abilities rendering their success nearly unjustifiable relative to the strength of enhancements made to their attack. Chief of these were the addition of forwards Andre Burakovsky and Oliver Bjorkstrand.
What followed was the highest increase in scoring (+57) in the league. Offensive production blossomed, albeit finishing was the only aspect of their offensive game which significantly improved.

Via MoneyPuck
Although an influx of shooting talent can bolster scoring, in the end, shooting talent is weaponized by generation, not the other way around. As agents of strategy, shooters are little more than powerless to improve their team’s playbook. Seattle absolutely could have struggled in generating quality scoring opportunities and still converted the ones they did at a high rate, solely because strong shooting talent can do more with any opportunity than poor shooting talent, even weak opportunities.
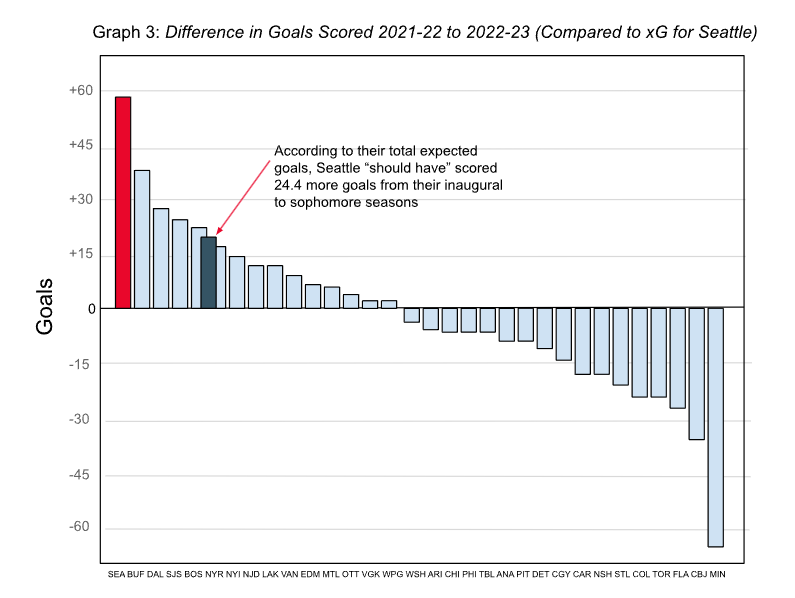
Burakovsky and Bjorkstrand are statistically strong shooters. Nevertheless, it’s unlikely the team should have seen the stark increase in scoring they did. We know this because based on the quality of their scoring opportunities, Seattle should have scored around 176.4 goals last season, 32.6 fewer than the 209 they did. Two shooters could not be singularly responsible for reaching 209– Burakovsky didn’t play a full season, and the calculation of 176.4 goals factors in the generative contributions of both wingers.
Comparatively, they should have scored 147.82 goals in their inaugural season, only 4.18 fewer than the 152 they scored.
Via MoneyPuck
In other words, Seattle’s offensive production in their inaugural season was more accurate to the scoring opportunities they generated than it was last season, the season which was intended to rectify offensive issues. A majority of the 57 goals they improved by were scored above expected (32.6), making that success fairly unsustainable. Ideally, a team’s expected and actual goals remain close, as results should be justified by the work done to earn them.
Generation functions as that evidence; it’s a test of how well a team can execute scheme. And while offense can be dissected into two stages, generation feeds into finishing. It would have to, otherwise there’d be no reason to heed offensive stratagem. If a team’s generative ability is severely outperformed by their finishing, if effort cannot justify their success, how did they succeed?
Seattle out-scored the capabilities of their offensive stratagem. They were not able to create scoring opportunities dramatically better in their sophomore season than their inaugural form, yet improved dramatically anyways. There’s grounds for questioning that improvement’s legitimacy, sustainability.
Recall that finishing is rooted in chance. The force behind Seattle’s offensive turnaround could be luck.
By adding together collective shooting and save percentages, PDO calculates how much a team benefited from good fortune via two of the most infamously random stats in contemporary analytics. Shots that score + shots that are saved must = 100, so the further a team’s PDO is from 100 indicates a larger presence of chance in their performance. Higher than 100 skews toward luck, lower towards misfortune.
Unsurprisingly, Seattle was unlucky in both shooting and saving during their inaugural season, with a PDO sitting at 98.1 That number jumped to 101.1 this past season.

Via NaturalStatTrick
It’s a sudden, striking increase parallel to the one their shooting percentage underwent. Examining the effect of this luck on single games, Seattle improved from scoring 2.23 goals per game to 3.09 when they were expected to hit 2.60 per game. They benefited from an extra ~0.50 goals scored above expected per sixty minutes, the largest positive disparity between G/60 and xG/60 in the league, and improved from scoring
Without straying off track and diving into goaltending data, it’s clear Seattle’s luck had more to do with boosting their shooting than their goaltending which, depending on the model, collectively performed as expected or slightly worse. And while inevitable, and certainly not unappreciated, luck isn’t enough to build offense on. Teams must build strong generative habits regardless of how chance’s favor may fall.
Concerningly, for Seattle, finishing did the offensive heavy lifting. They owned 56.33% of the total goals scored last season, accomplished with control over 51.88% of the total shot quality– barely an advantage. Granted, Seattle’s philosophy is one that sacrifices dangerous scoring opportunities in exchange for airtight defense, naturally inhibiting their potential to be excessively offensively dominant. Gaining only a slight advantage in shot quality could be demonstrative of stratagem operating exactly as intended.
Securing an edge in shot quality after playing at the mercy of their opponents offensively is good progress, however, subjected to the ebbs and flows of finishing, 51.88% might not translate to concrete scoring advantages in the future. What goes up must come down, and regression could lie on the horizon.
Untangling how Seattle generated shot quality last season will provide a better estimate of how reliable their production is, and consequently, how it could be impacted going forward. Shot quantity and shot quality are the two pillars of generative analytics, as shots serve as parameters for how well a team is controlling, moving throughout, and strategizing in the offensive zone.
The difference in a team’s shot quantity may not be premeditated, as increases or decreases in shots do not necessarily equal more or less offense. Nevertheless, shot volume and frequency should be checked like a pulse– these totals convey the ease or difficulty with which a team is establishing in the offensive zone and generating scoring opportunities.
Via NHL & MoneyPuck
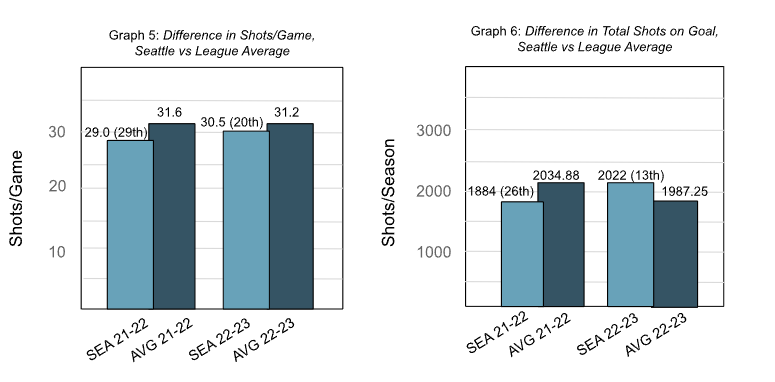
As seen above, not much changed for Seattle from season to season in terms of shot quantity. Shots have trended downward across the league, with 0.38 fewer taken on average per game and 47.63 fewer taken per season. Seattle took 1.5 more shots per game their sophomore season, and 138 more in total.
Despite the small sample size, Seattle has remained a conservative team when it comes to shooting frequency and volume. As noted in an article from March 2023, for Seattle, an increase in shooting volume can be interpreted as difficulty converting scoring opportunities to goals, possibly as a symptom of waning finishing.
Widening the scope of shot metrics, Seattle increased their total unblocked shot attempts by 256, the second-largest increase in unblocked shot attempts in the league. That being said, Seattle missed the net more often, increasing from missing 28.53% to 30.08% of their unblocked attempts.
Shot and shot attempt totals generally aren’t a facet of offense under intense focus, rather, the quality and distribution of those shots are.
Digging into individual shot grades, Seattle’s distribution of shots across low, medium, and high danger is comparable to the league average. They’re not generating an excess of low danger shots relative to their totals in higher danger shots. However, Seattle does not exercise a high danger quality advantage over the rest of the league, making their inability to generate them potentially a point of weakness. Their 143 high danger shots are low even if that number increased from an even lower 111 accumulated in their inaugural season.

Via MoneyPuck
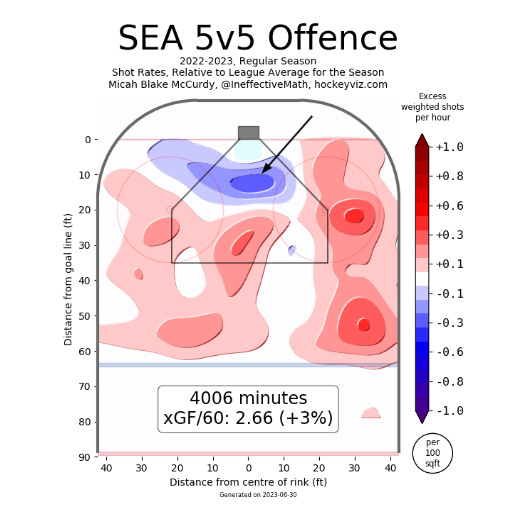
By far the biggest difference in Seattle’s method of generating shot quality, and the reason they were able to secure a quality advantage on the season, is their improved distribution of shot volume throughout the offensive zone.


Via HockeyViz
Location is a huge factor in assuming offensive leverage and increasing shot quality. The closer a team can get to their opponent’s net and the center of the offensive zone, the higher danger their shots become. It’s a phenomenon that revolves around the concept of the home plate, the most dangerous area of the offensive zone, wherein a majority of goals are scored.
Breaking out from the perimeter to penetrate the faceoff circles and high slot for shots allowed Seattle to establish extensive control over the offensive zone, something they lacked inaugurally. Getting closer to the net increased their shot quality, and broadening the location of their shots nuanced their attack variety, improving unpredictability. At the same time, they lost their high concentration of point shots. Given that shots decrease in quality as distance from the goal line grows, this is likely for the best.
Seattle improved greatly in their control over the offensive zone, but there is still work to be done in taking advantage of the ‘dirty areas’ of the ice. A lack of chances around the net-front area– responsible also for their lack of rebounds and point-blank attempts– explains their struggle to generate high danger shots.
Via HockeyViz
With this offensive zone structure, Seattle scored more goals at five-on-five than the Boston Bruins (200), New Jersey Devils (197), Buffalo Sabres (197), and Edmonton Oilers (193). All of said teams had stronger concentrations of attack in the high danger areas Seattle avoided.

Via HockeyViz
So Seattle’s shot location improved greatly, but mostly in comparison to their inaugural season– their offensive presence is still nonexistent in the highest danger areas of the ice, and thus, their seasonal advantage in shot quality hardly asserts itself as one.
As far as pre-shot movement goes, Seattle has continued to excel in shots off the rush and the forecheck, while their ability to create high danger passes has remained low. For Seattle, speed and aggression continue to rule the offensive zone as opposed to deception, a style of play set on beating opponents simply by overwhelming them. Seattle can easily take advantage of an opponent’s mistakes this way, and do often. Consequently, they can fall into a dependence on an opposing misstep in order to create offense, given they struggle to access high danger areas themselves.
All information considered composes the image of a team which…
Enjoyed a massive increase in finishing/shooting success largely due to luck
Gained a small edge in shot quality on the season by broadening their attack location, prioritizing extensive control over the offensive zone instead of limiting themselves to the blue line
Remained conservative when it came to shot quantity but saw a slight increase in shooting frequency potentially as a result of difficulty generating scoring opportunities (of which declining shot accuracy and an inability to access high danger areas could contribute to)
Continued to attack the offensive zone with speed and aggression rather than deception, and founded offensive zone puck movement largely on low danger passes
And established offensive dominance through finishing rather than generation
Seattle’s abnormally successful finishing created the impression that their ability to generate scoring opportunities was more dangerous than it truly was– their massive increase in production, while laudable, was built on a proportionally weak generative foundation.
So how well will their current offensive habits hold up? What, if anything, should be improved next season? This and more to be explored in Part III.